MyCellome

Interactive publications for single-cell data

Every cell and every gene, in a page anyone can read.

We turn single-cell and spatial analyses into web pages that keep the data in them. Readers search a gene, pick a cell type or open a pathway, and the figures redraw from the data, so a finding can be checked, not just looked at.

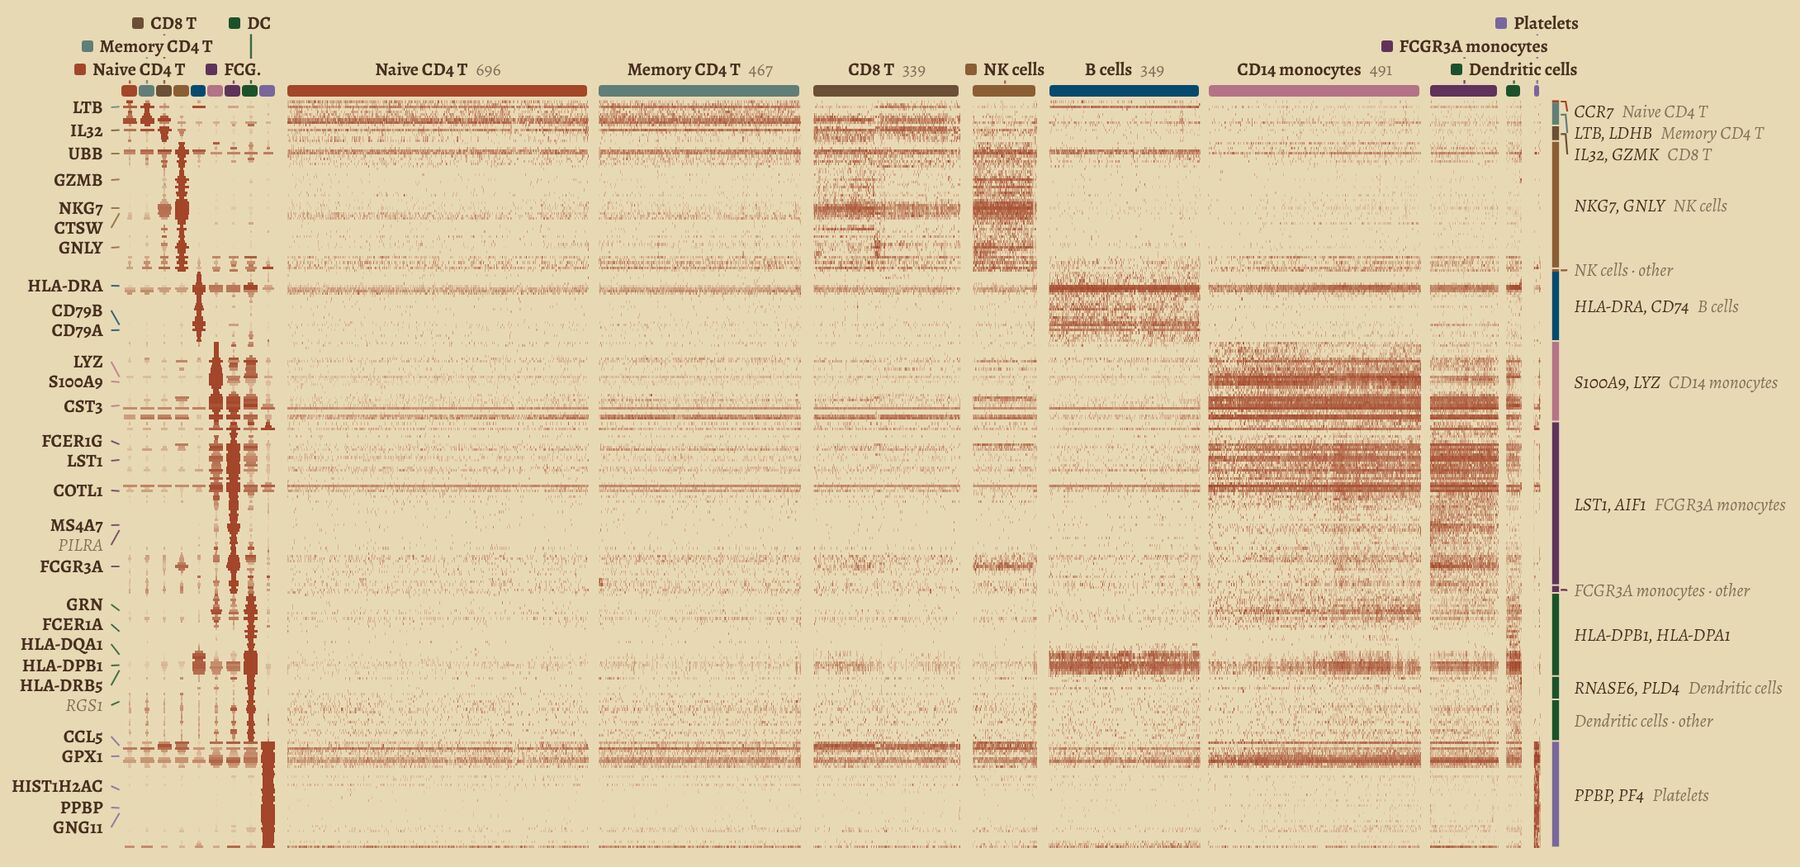
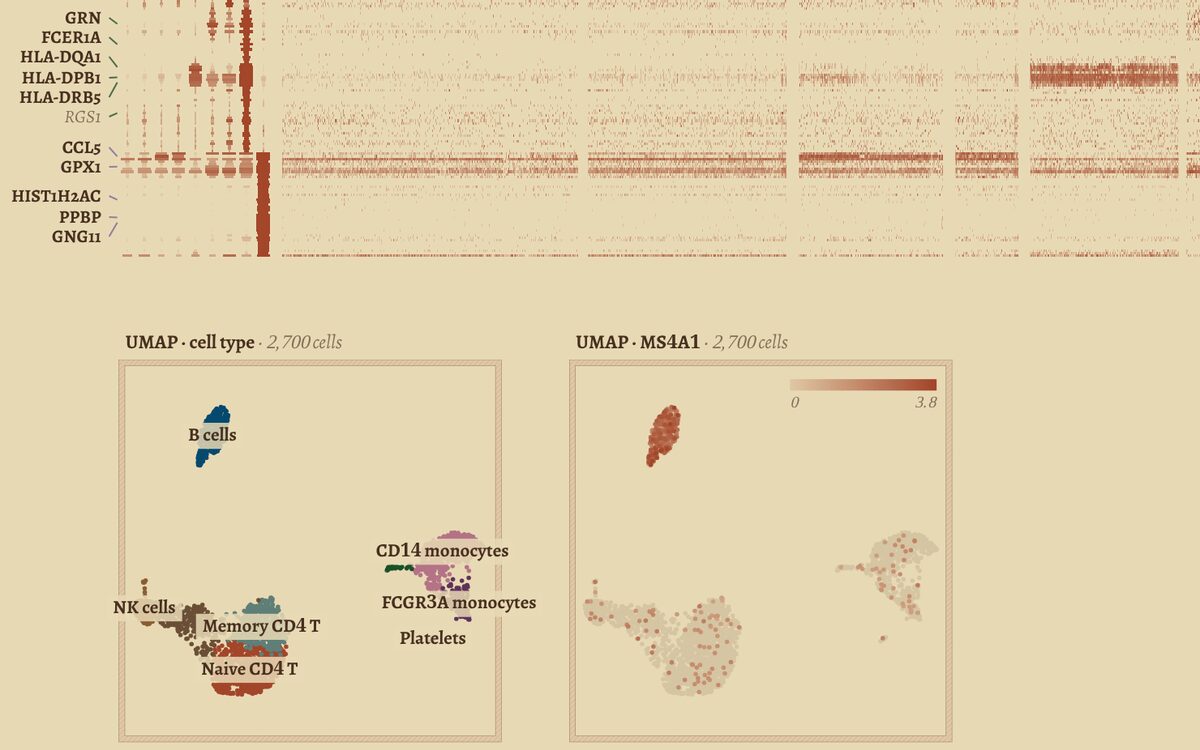
A gene wall from the PBMC explorer: 2,700 blood cells, one column per cell, grouped by type, with each type’s marker genes as rows.

Work

Published pieces

Built from public datasets. Each one opens in the browser, with nothing to install.

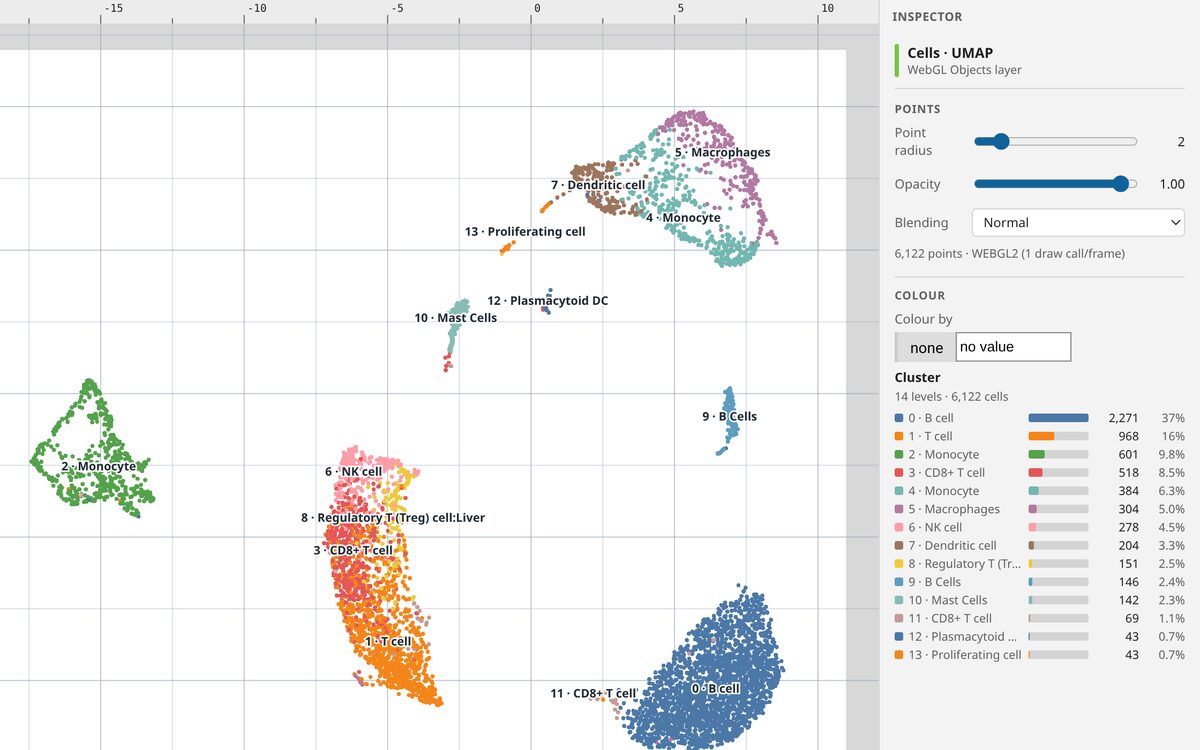
A single-cell report on a lung tumour

  • 6,122 cells
  • 14 clusters
  • human NSCLC
  • 7 sections

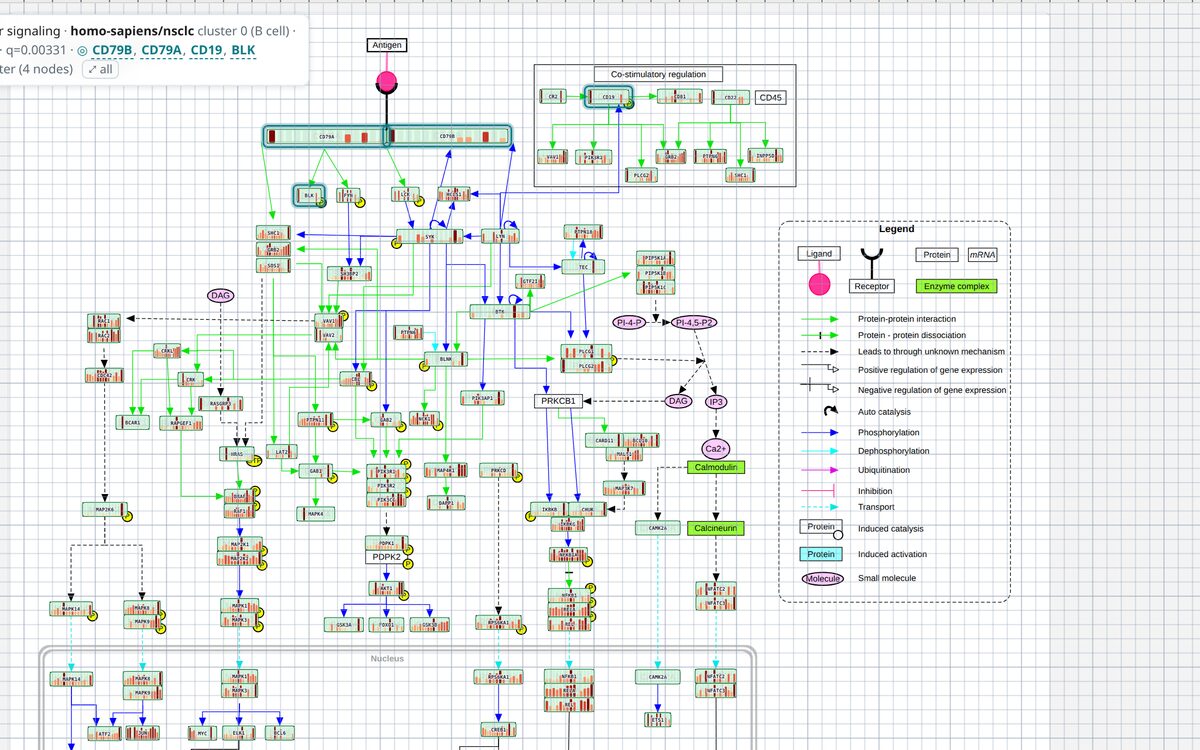
A full data report, covering quality control, clusters, cell-type labels, markers and pathway and GO enrichment, with live explorers beside it. Colour the cell map by any gene, read every cell on a gene wall, lay out a dashboard of linked charts, or open an enriched pathway drawn with the tumour’s own expression.
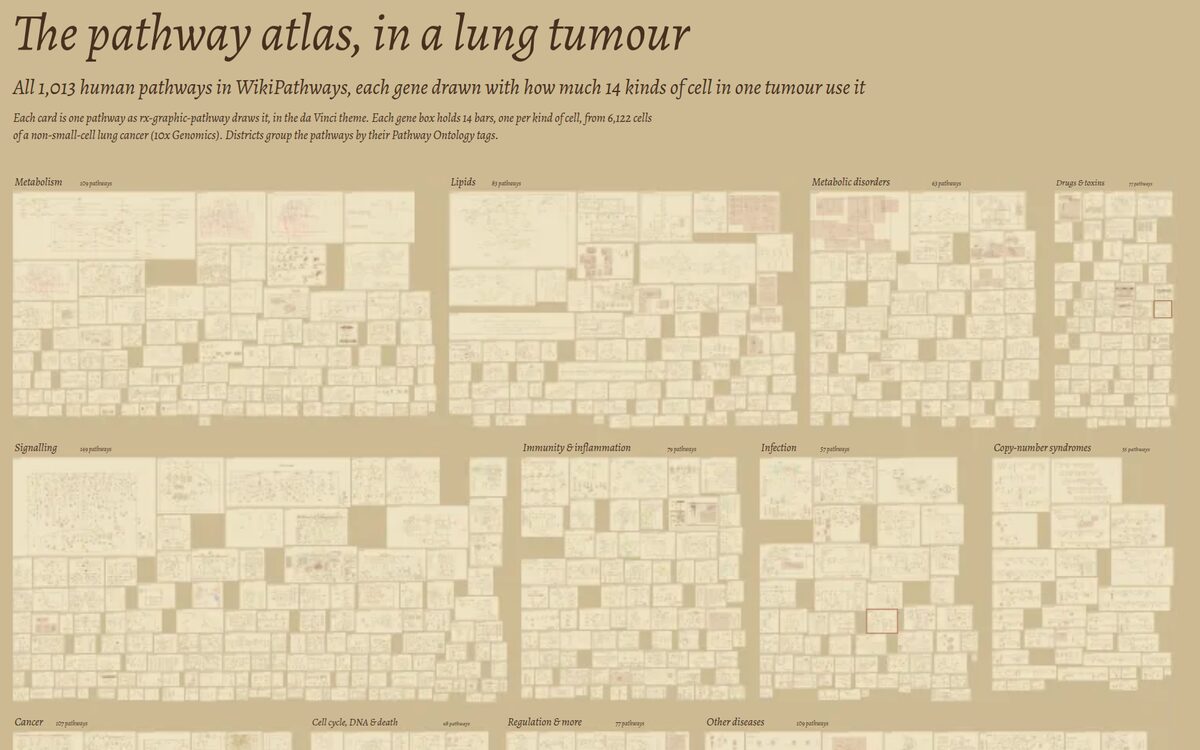
The pathway atlas: hundreds of small pathway diagrams packed into districts such as metabolism, signalling and immunity.

The pathway atlas, in a lung tumour

  • 1,013 pathways
  • 14 kinds of cell
  • deep zoom

Every human pathway in WikiPathways on one page. Each gene box holds 14 bars, one for each kind of cell in the same tumour, showing how much it uses that gene. Zoom from the districts down to a single gene.

The PBMC explorer: the lower rows of the gene wall above two UMAP maps, one coloured by cell type and one by the gene MS4A1.

PBMC explorer

  • 2,700 cells
  • 9 cell types
  • gene search

Peripheral blood cells on one gene wall, every cell a column, next to cell maps coloured by type and by gene. Controls let you search a gene and choose a cell type.

Data: 10x Genomics public datasets (PBMC 3k; non-small-cell lung cancer, CC BY 4.0) and WikiPathways (CC0).

Live demo

The Cellome Grid Reader

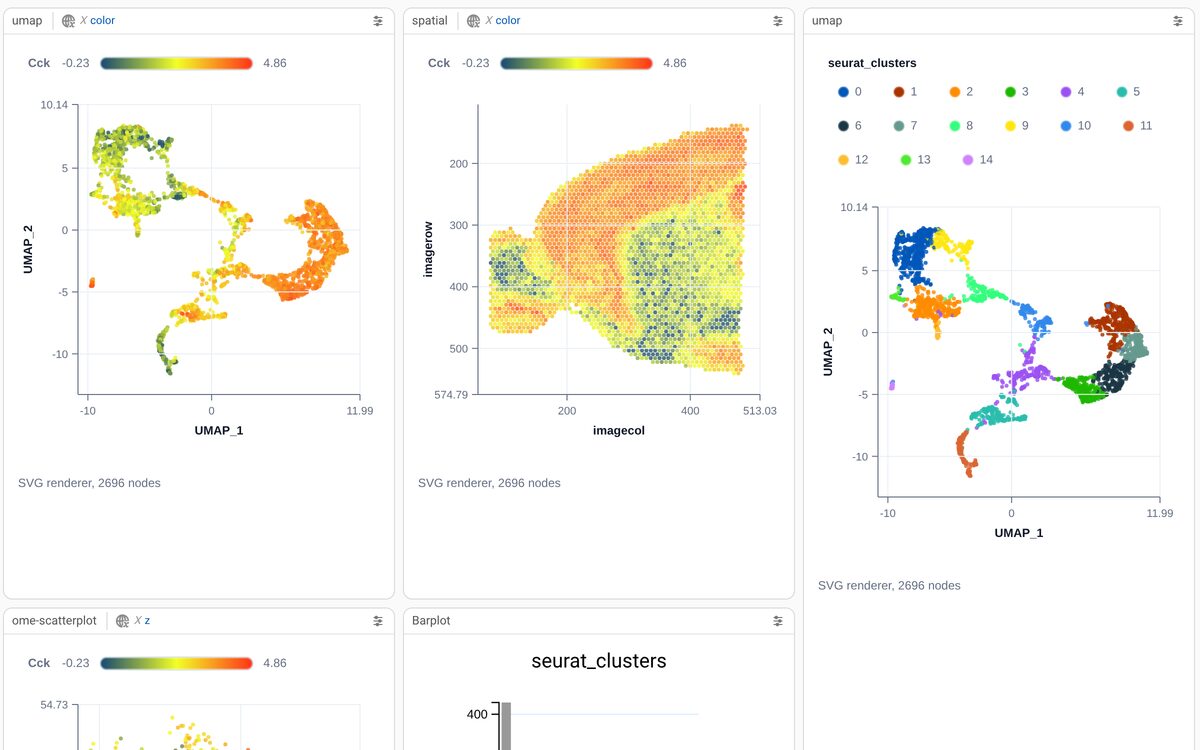
Linked panels: a UMAP and a tissue section both coloured by the gene Cck, and a UMAP coloured by cluster.

Linked panels over a spatial dataset

  • 2,696 spots
  • mouse brain
  • Visium

Seurat’s spatial example on a grid of panels. Type a gene once and the UMAP and the tissue section recolour together. Switch a panel to another data source, or give it settings of its own.

How it’s made

From an analysis to a publication

Start from your analysis

A Seurat object, or any cells-by-genes matrix, becomes a cellome package: cell metadata, markers, and the expression matrix in an indexed tidx file.

Compose the page

Cell maps, gene walls, pathway diagrams and guided views sit on one zoomable page. Every chart draws from the data, so choosing a gene changes them all.

Publish a folder

The result is a folder of static files that any web host can serve, with no database or login. The browser fetches only the genes a reader looks at.

Contact

Have a dataset that deserves a better page?

We build custom single-cell and spatial publications for labs and companies, from the analysis to the published page.